(Reprinted from HKCER Letters, Vol. 49, March 1998)
Trends in Asia-Pacific Real Exchange Rates
Menzie David Chinn
In the wake of the turmoil in East Asian currency markets, several Southeast Asian countries--Thailand, Indonesia, the Philippines and Malaysia--allowed their currencies to float relatively freely during the summer of 1997. Even the currencies of Taiwan and Korea have been forced towards more flexibility. These moves represent a substantial departure from the previous practice of tightly managing currencies against the US dollar. Two questions naturally arise from these events. First, were these currencies overvalued at the time of the speculative attacks on them? Second, what are the prospects for a return to pegged or managed exchange rates, in light of knowledge about what determines exchange rates?
In order to answer the first question, one needs a theory of equilibrium exchange rates. Economists are accustomed to thinking of the nominal exchange rate between two currencies as being determined by the ratio of the price levels in the respective countries. The higher the price level at home, the more units of domestic currency must be exchanged to obtain a given amount of foreign exchange. This is one interpretation of the "purchasing power parity" (PPP) concept. While few economists believe that this condition holds day by day, there is a consensus that it does hold over the course of several years, when arbitrage activities are allowed to exert their effects. When one looks at it from this perspective, neither productivity nor government spending play a role.
The exchange rates of many newly industrializing economies (NIEs) of the Asia-Pacific provide interesting counter examples to this view. They have experienced currency movements not offset by corresponding changes in price levels. Instead, several of these "real" (inflation-adjusted) exchange rates display pronounced trends. One hypothesis, credited to Bela Balassa and Paul Samuelson, argues that while the prices of the two countries' tradable goods are equalized, the prices of some items such as services are not, since they are not internationally traded. Consequently, the real exchange rate depends upon the relative prices of tradable to nontradable goods in the two countries. This relative price in turn may be determined by productivity levels in the tradable and nontradable goods sectors.
Exactly because the Asia-Pacific economies are characterized by rapid manufacturing sector productivity growth, they provide an excellent opportunity for testing this hypothesis. On this note, I examine the implied relationship between the real exchange rate and prices of tradable goods versus nontradable goods, or sectoral productivity levels, in pairs of countries. I also investigate whether government spending, expressed as a proportion of GDP, and oil prices have an independent effect.
Past research has been hampered by the unavailability of sectoral productivity data, and so researchers have either restricted themselves to examining only the first portion of the of the Balassa-Samuelson hypothesis--that relative prices of tradable to nontradable goods should determine the real exchange rate--or have indirectly tested the hypothesis by assuming that income per capita is highly correlated with the tradable/nontradable productivity differential. In the following section I econometrically reexamine the evidence for seven Asia-Pacific countries. I then move beyond the previous literature and investigate the link between real exchange rates and sectoral productivity differentials.
It should be stressed that discussion of short-term movements in real exchange rates, which may arise from interest rate differentials or the transitory effects of financial liberalization, is omitted. Rather, the focus is on equilibrium, and hence longer-run exchange rate behavior.
A common finding in the real exchange rate literature is the so-called "Penn Effect" (after Irving Kravis, Alan Heston, and Robert Summers at the University of Pennsylvania, who first detected it in a cross section of countries). This effect is the correlation between higher per capita incomes and stronger real exchange rates. Two explanations have been forwarded for this stylized fact. The first is that higher incomes are associated with higher propensities to spend on nontradable goods (services), so that prices for these are higher (call this the preferences-based model). The second view is that higher incomes reflect higher productivity levels, primarily in the tradable, or manufacturing, sector (the productivity-based model).
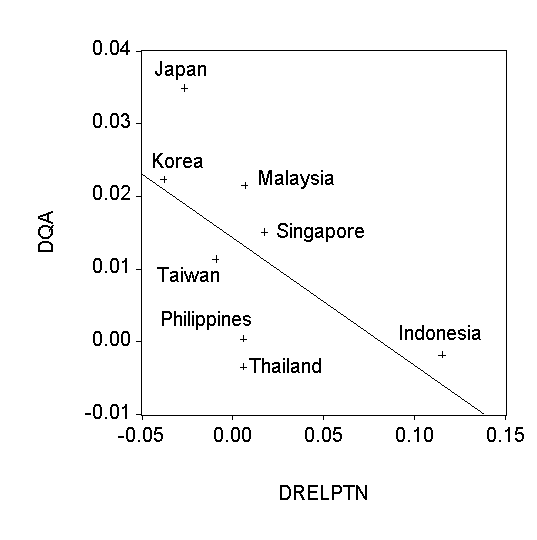
Real Exchange Rates and Relative PricesRecent work has focused on the roles of relative prices in real exchange rates, largely because the data are easily available. Isard and Symansky (1996) examine this relationship for the Asia-Pacific Economic Cooperation Council (APEC) nations. Employing a decomposition of real exchange rate changes over the 1973-92 period, they conclude that Indonesia (since 1985), Malaysia, Singapore and Thailand provide counter examples to the Balassa-Samuelson hypothesis. In Figure 1 the 1970-91 annual percent change in the real bilateral exchange rate (expressed as real US$ per real foreign currency unit) against the percent change in relative prices is presented for Indonesia, Japan, Korea, Malaysia, Philippines, Singapore, Taiwan and Thailand. Relative prices are defined as the US price of services divided by the price of manufactured goods divided by the analogous ratio for the East Asian country. A best-fit-line is also included to show the relationship between the two variables, which according to the theory should be negative. Superficially, the data appear to conform to the theory; however the slope coefficient is only about -0.18, while a value closer to -0.5--assuming the share of nontradables in the aggregate price index is about one-half--is what one would expect.
To investigate the issue more carefully, I estimate time series regressions of the change of the real exchange rate on the level of the real exchange rate and the relative price variable. The results conform to theory for the countries in the sample, with the exception of Singapore and Taiwan (although the relationship is only statistically significant for Indonesia, Japan and Korea). The negative results for Taiwan may arise from the manner in which the data are collected; Young (1995) points out that Taiwan does not actually estimate government productivity growth but rather assumes it, thus imparting a bias to the service sector price index. Singapore poses a different problem. Since its ratio of exports plus imports to GDP exceeds one, it may be inaccurate to classify services as a nontradable in this case. If there is no (or a very small) nontradable sector, then perhaps a different model that does not require equalization of tradable goods price may be more appropriate.
f relative prices of tradable versus nontradable goods determine real exchange rates, then the natural question to ask is what determines relative prices. Assuming economies are open to the free flow of capital and international trade, and labor and capital are free to move domestically, relative sectoral productivity differentials are the key factor. The higher tradable sector productivity is, the higher the relative price of nontradable goods, and hence the stronger the currency in real terms, holding everything else constant. This hypothesis has not been directly investigated for less-developed countries, primarily because of data limitations. Typically, only time series data for aggregate, rather than sectoral, productivity exist. Unfortunately, using aggregate productivity as a proxy for the differential in sectoral productivity is valid only under some very strict and implausible conditions. Consequently, I use sectoral labor productivity indices calculated by dividing real output by employment. The data are obtained from the World Bank, the Asian Development Bank, and for the US and Japan, from the OECD.
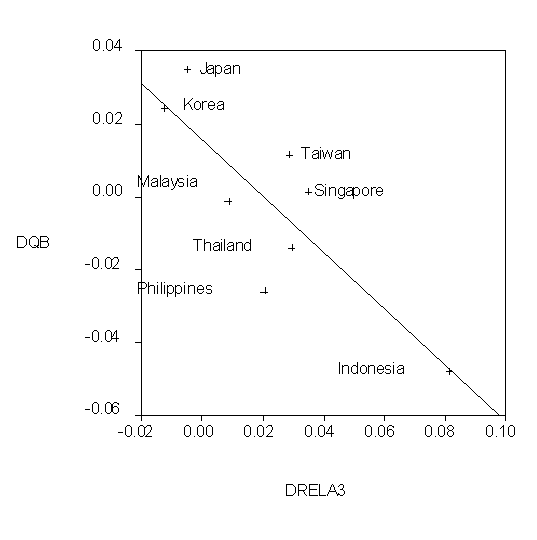
Real Exchange Rates and Relative ProductivityIn Figure 2 the average annual percent change in the real exchange rate change is plotted against the percent change in the relative sectoral productivity differential, defined as US manufacturing sector productivity divided by service sector productivity divided by the analogous variable for the East Asian country. (The data sample is not exactly the same as those in Figure 1, so the change in the real exchange rate may not match up in the two figures.)
The relationship is stronger than that displayed in Figure 1. The slope coefficient is now -0.77, much closer to the posited value. However, the cross section averages can mask a great deal of variation over time. Proceeding to a currency-by-currency basis, I find that Japan, Korea, Malaysia, and the Philippines fit into the productivity-based model; Indonesia also fits as long as oil prices are allowed to affect the long-run real exchange rate. Government spending has only short-run effects, and then only in a statistically significant manner for the Indonesian, Korean, and Philippine currencies.
Singapore, Taiwan, and Thailand fail to evidence any significant role for productivity variables in levels. Since the first two economies failed to conform to the first portion of the Balassa-Samuelson model, this outcome is unsurprising. In the case of Thailand, the inconclusive results may arise from the very short span of data (thirteen observations, 1978-1990) available for analysis. However, one can identify a relationship in growth rates, so productivity growth does matter.
The productivity-based model of long-run real exchange rates clearly has some empirical validity, especially when augmented by a demand-side variable like government spending, or by terms-of-trade proxy like the price of oil. These findings also suggest that one can differentiate between the preferences and the productivity-based explanations for the Penn Effect, in favor of the latter.
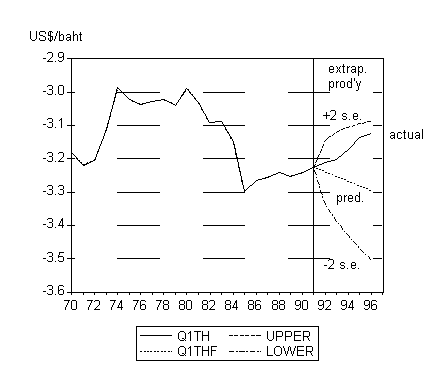
Policy ImplicationsWhat does the model say about the Thai baht on the eve of the currency crisis? Productivity data broken down by sector is not available post-1991, so some extrapolation is necessary. I assume that the 1978-91 trend in US-Thai productivity differential continued up to 1996 (this is a rather optimistic assumption). The equilibrium and actual real exchange rate (now defined using consumer price indices rather than GDP deflators) are plotted in Figure 3. These back-of-the-envelope calculations indicate that as of 1996 the baht was already approximately 17% overvalued relative to the US dollar, although this estimate must be taken with some circumspection, as this value was within the 95% confidence band. By September 1997 the baht had dropped to somewhere near the bottom of the confidence band.
The uncertainty about equilibrium values leads one to question once again the desirability of reestablishing a regime of loosely pegged exchange rates. The events of 1997 suggest that speculative attacks can easily wipe out large foreign exchange reserves, unless the exchange rate is at some sustainable level. What constitutes a "sustainable" or equilibrium level is difficult to ascertain at any given instant and is likely to change over time. Consider the problem of setting a peg for the nominal exchange rate. To maintain the exchange rate at a sustainable level would require constant adjustments for inflation differentials, as well as productivity differential growth. Compounding the problem is the fact that productivity data are notoriously imprecise and are reported with a very long lag. Given the difficulties in determining equilibrium exchange rates with any degree of certainty and timeliness, it is likely that the era of tightly managed exchange rates in the Asia-Pacific region is over.
Dr. Menzie the David Chinn is associate professor in the Department of Economics, University of California, Santa Cruz.
Figure 1: Average annual percent change in real exchange rate and relative prices, 1970-91.
DQB is the average percent change in the bilateral real exchange rate, expressed in real US$ per real local currency unit, DRELPTN is average percent change in relative price of nontradables, US relative to local East Asian Country.
Figure 2: Average annual percent change in real exchange rate and productivity differential, 1970-91.
DQB is the average percent change in the bilateral real exchange rate, expressed in real US$ per real local currency unit, DRELA 3 is the average percent change in manufacturing / service and construction section productivity differential, US relative to local East Asian Country.
Figure 3: Real and equilibrium exchange rates, Thai baht
Q1TH is the bilateral real US$ / Thai baht exchange rate.
Q1THF is the predicted value, using the extrapolated trend in relative productivity.


